Local business prospecting is not just about finding more companies. It is about identifying the right businesses, reaching the right decision-makers, and turning prospects into paying customers.
A sales team can collect thousands of business records, send hundreds of emails, and make dozens of calls without generating meaningful revenue. The problem is often not a lack of activity. It is a lack of visibility into what actually works.
That is where prospecting KPIs come in.
With a structured approach to lead generation, contact management, and sales pipeline tracking, businesses can identify weak points, reduce wasted effort, and focus on the activities that generate qualified opportunities.
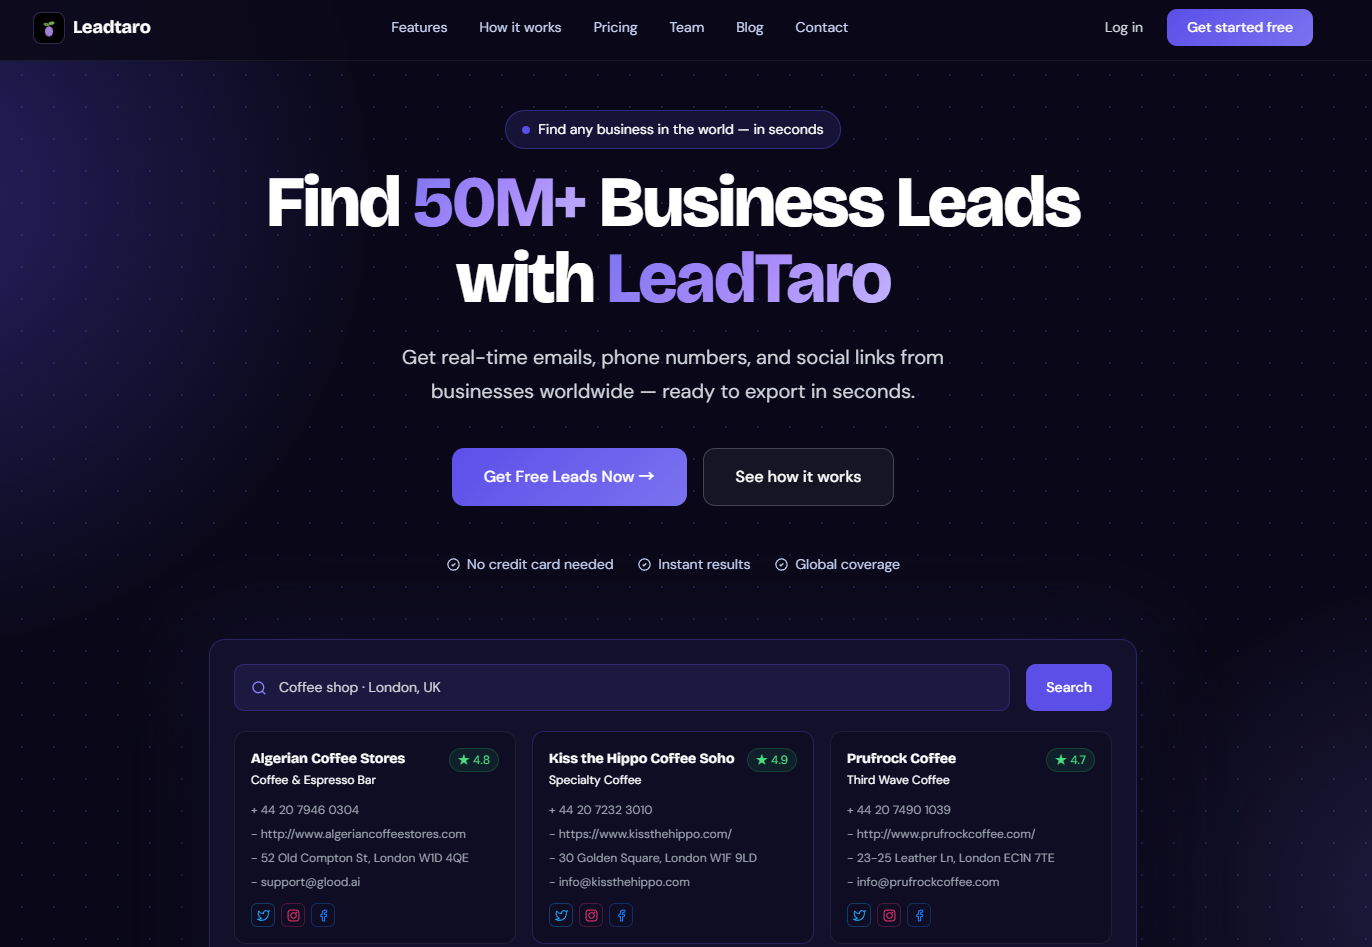
LeadTaro helps sales teams discover business leads, review available contact information, export prospect data, organize leads in a sales pipeline, and prepare personalized cold emails. By combining these workflows with the right performance indicators, teams can make more informed prospecting decisions.
In this guide, we cover 20 essential KPIs for local business prospecting, explain how to calculate them, and show how to use the results to improve your sales process.
Table of Contents
Why Local Prospecting KPIs Matter in 2026
Lead Generation and Qualification KPIs (1–7)
Customer Acquisition and Cost KPIs (8–14)
Operational and Performance KPIs (15–20)
Industry Benchmarks for Local Prospecting
How to Track Prospecting KPIs with LeadTaro
Common Mistakes When Measuring Prospecting Performance
A Practical Prospecting KPI Dashboard
Frequently Asked Questions
Why Local Prospecting KPIs Matter in 2026
Local business prospecting gives companies a practical way to identify potential customers by industry, location, business type, and other relevant characteristics.
For example, a web design agency might target restaurants without websites. A commercial cleaning company might focus on offices, retail stores, and hospitality businesses. A marketing agency might prioritize businesses with outdated websites or limited online visibility.
Each campaign has a different audience and a different definition of a qualified lead.
Without measurement, it is difficult to know whether a campaign is underperforming because of poor targeting, incomplete contact information, ineffective messaging, or a weak sales process.
Tracking the right local prospecting KPIs helps answer five important questions:
Are we finding enough relevant businesses?
Do our leads match our ideal customer profile?
Can we reach the businesses we identify?
How efficiently are we converting prospects into opportunities?
Are our prospecting activities generating profitable customers?
Lead volume alone cannot answer these questions. A smaller list of highly relevant prospects may generate more revenue than a much larger list of poorly matched businesses.
The goal is not simply to collect more leads. It is to build a repeatable process that turns prospect research into measurable sales results.
Lead Generation and Qualification KPIs (1–7)
Lead Volume Metrics (KPIs 1–3)
KPI #1: Total Local Leads Generated
What it measures: The number of new business prospects added during a specific period.
This is the starting point for evaluating your prospecting activity. It shows whether your team is consistently building a pipeline of potential customers.
Calculate it by counting the unique leads added during a campaign, week, or month.
For example, a marketing agency might identify 300 local businesses in a month. However, if 80 are duplicates and 70 do not match its target market, the original volume overstates the number of useful prospects.
Track both total records and unique, qualified businesses to understand the real output of your research.
LeadTaro can help you discover business leads and organize the results into a more manageable prospecting workflow.
KPI #2: Lead Source Distribution
What it measures: The proportion of your prospects generated through each source or acquisition method.
Different sources can produce different levels of lead quality and conversion.
Track the sources relevant to your business, such as:
Business lead databases
Website research
Referrals and inbound inquiries
Industry directories
Manually researched prospects
Existing CRM records
For each source, compare lead volume, contactability, qualified opportunities, and closed deals.
For example, a database may produce 1,000 leads, while manual research produces only 100. If the smaller group generates more qualified meetings, it may deserve a larger share of your prospecting time.
LeadTaro can support business lead discovery and prospect organization, while source-level attribution should be recorded consistently in your CRM or tracking spreadsheet.
KPI #3: Geographic Coverage Rate
What it measures: The percentage of your defined target territory that has been adequately researched.
Geographic coverage matters when your sales strategy depends on specific cities, regions, or service areas.
Use this formula:
Geographic Coverage Rate = Researched Target Areas ÷ Total Target Areas × 100
Suppose a commercial services company plans to prospect 20 towns and has completed research in 12 of them.
Its geographic coverage rate is 60%.
This metric helps identify neglected areas and prevents sales teams from repeatedly targeting the same familiar locations while overlooking new opportunities.
LeadTaro can help you find businesses by location and category, making it easier to organize prospecting campaigns around specific geographic markets.
Lead Quality Indicators (KPIs 4–6)
KPI #4: Lead Scoring Accuracy
What it measures: How effectively your lead scoring criteria identify prospects that eventually become qualified opportunities or customers.
Not every business is equally valuable to your company.
A web design agency might prioritize businesses with no website, while a reputation management service might focus on businesses with poor customer reviews. A B2B software provider might prioritize company size, industry, and contact availability.
Assign scores using criteria that reflect your ideal customer profile.
For example:
Qualification criterionExample scoreMatches target industry+3Located in the service area+2Has a relevant business need+3Has usable contact information+2Outside the target market-5These scores are illustrative and should be adjusted to your business.
Review the results after each campaign. If high-scoring prospects consistently become customers, your model may be working well. If they rarely convert, reconsider the criteria.
LeadTaro's business discovery and lead management workflows can help you organize prospects for qualification and follow-up.
KPI #5: Data Freshness Rate
What it measures: The percentage of prospect records whose important business information has been checked recently enough for your campaign.
Business information changes over time. Companies relocate, websites go offline, phone numbers change, and employees move to different roles.
Use this formula:
Data Freshness Rate = Recently Verified Records ÷ Total Records × 100
Define what recently verified means for your campaign. For example, you might require contact details to have been checked within the last 90 days.
Do not assume that a recently collected business listing automatically contains a verified email address or working phone number. Freshness and accuracy are related but different concepts.
Monitor email bounces, disconnected phone numbers, incorrect websites, and outdated business details to identify records that need further verification.
KPI #6: Contact Information Completeness
What it measures: The proportion of prospect records containing the contact fields required for your outreach strategy.
Relevant fields may include:
Business name and location
Website URL
Phone number
Business email address
Relevant social profiles
Contact or decision-maker details, when available
Calculate completeness based on the fields your campaign actually needs.
For example, if 720 of 1,000 prospects have all the required contact fields, your contact completeness rate is 72%.
A complete record does not necessarily mean that every detail is correct or that the contact will respond. Track successful delivery and connection rates separately.
LeadTaro helps users review available business information and unlock supported lead details where applicable, making it easier to prepare prospects for outreach.
KPI #7: Lead-to-Opportunity Conversion Rate
What it measures: The percentage of leads that become qualified sales opportunities.
Use this formula:
Lead-to-Opportunity Conversion Rate = Qualified Opportunities ÷ Leads Contacted × 100
Suppose your team contacts 400 businesses and 32 become qualified opportunities.
Your conversion rate is 8%.
The key is to define a qualified opportunity consistently. Depending on your business, this might mean a prospect has expressed interest, agreed to a meeting, requested a proposal, or confirmed a relevant business need.
Do not compare campaigns using different qualification criteria.
If your conversion rate is low, examine your targeting, contact information, outreach messaging, and follow-up process before simply increasing lead volume.
Customer Acquisition and Cost KPIs (8–14)
Finding leads is only part of the process. You also need to understand what those leads cost and how much revenue they generate.
Cost-Related Metrics (KPIs 8–11)
KPI #8: Cost Per Lead (CPL)
What it measures: The average cost of acquiring one prospect.
Use this formula:
Cost Per Lead = Total Lead Generation Costs ÷ Leads Generated
Include relevant expenses such as prospecting software, data services, research time, and campaign-specific labour.
For example, if a campaign costs £300 and generates 600 leads, the cost per lead is £0.50.
Calculate CPL separately for each source or campaign. Otherwise, an inexpensive channel may hide the poor economics of another.
When using LeadTaro, include the applicable subscription or credit costs, if any, along with your team's operating expenses.
Remember that a cheap lead is not automatically a valuable lead. The more useful comparison is often the cost per qualified opportunity or acquired customer.
KPI #9: Customer Acquisition Cost (CAC)
What it measures: The average cost of acquiring a new paying customer.
Use this formula:
CAC = Total Sales and Marketing Acquisition Costs ÷ New Customers Acquired
Include the costs associated with generating, contacting, qualifying, and converting prospects. Depending on your accounting method, these may include employee salaries, software, advertising, outreach infrastructure, and sales commissions.
Suppose your monthly acquisition costs total £3,000 and you acquire 10 new customers.
Your CAC is £300.
Track CAC over time and compare it with customer lifetime value. If acquisition costs increase faster than customer value, your growth model may become unsustainable.
KPI #10: Cost Per Qualified Lead
What it measures: The average amount spent to generate a prospect who meets your qualification criteria.
Use this formula:
Cost Per Qualified Lead = Total Prospecting Costs ÷ Qualified Leads Generated
If a campaign costs £500 and produces 50 qualified leads, your cost per qualified lead is £10.
This metric is often more useful than raw CPL because it accounts for lead quality.
Improve it by refining your industry and location targeting, removing duplicate records, prioritizing relevant business characteristics, and improving your qualification process.
LeadTaro can support the discovery and organization stages, helping you focus your team's attention on prospects that fit your target market.
KPI #11: Channel Cost Efficiency
What it measures: How efficiently each outreach channel generates qualified opportunities or revenue.
Common channels include cold email, telephone outreach, social selling, direct mail, and referrals.
Track the total cost, number of contacts attempted, responses, qualified opportunities, and customers generated by each channel.
For example:
MetricEmail campaign APhone campaign BCampaign cost£100£250Prospects contacted500200Qualified opportunities1015Cost per opportunity£10£16.67In this example, email produces opportunities at a lower cost, while phone outreach generates more opportunities from a smaller prospect pool.
The right decision depends on opportunity quality, deal size, and the revenue each channel ultimately generates.
Revenue and Value KPIs (12–14)
KPI #12: Average Deal Size
What it measures: The average revenue generated by each closed customer or deal.
Use this formula:
Average Deal Size = Total Revenue from Closed Deals ÷ Number of Closed Deals
If your business closes 20 deals worth a combined £20,000, the average deal size is £1,000.
Segment this metric by customer type, industry, territory, and acquisition channel.
This helps you identify which prospects justify more research and sales effort.
For example, a commercial contract may be worth substantially more than a one-off service purchase. Your qualification criteria should reflect that difference.
KPI #13: Customer Lifetime Value (CLV)
What it measures: The total revenue or gross profit a customer is expected to generate throughout the relationship.
For a simple recurring-revenue business, you can estimate customer lifetime value using average revenue per customer, gross margin, and expected customer lifetime.
A simplified formula is:
CLV = Average Monthly Revenue × Gross Margin × Expected Customer Lifetime in Months
Suppose a customer generates £200 per month, has a gross margin of 70%, and remains a customer for 24 months.
Estimated gross-profit CLV is:
£200 × 0.70 × 24 = £3,360.
This estimate depends on your assumptions and retention data. For businesses with irregular purchases, use a model that reflects actual buying patterns.
CLV helps you decide how much to invest in acquiring and retaining customers.
KPI #14: CLV-to-CAC Ratio
What it measures: The relationship between customer lifetime value and acquisition cost.
Use this formula:
CLV-to-CAC Ratio = Customer Lifetime Value ÷ Customer Acquisition Cost
If gross-profit CLV is £3,360 and CAC is £840, the ratio is 4:1.
A higher ratio can indicate attractive acquisition economics, but the result depends on how CLV and CAC are calculated. There is no universal ratio that guarantees profitability across every industry or business model.
Monitor this metric alongside cash flow, payback period, retention, and growth rate.
If CAC rises while customer value remains stable, improve targeting, conversion, retention, or acquisition efficiency before scaling spending.
Operational and Performance KPIs (15–20)
Strong prospecting operations depend on consistent execution. The following metrics help you understand how quickly and effectively leads move through your sales process.
KPI #15: First Response Time
What it measures: The time between receiving an inbound inquiry or a meaningful prospect response and sending your first reply.
For inbound leads, a shorter response time can help your team engage prospects while their interest is high.
For outbound prospecting, distinguish between the time it takes to initiate first contact and the time it takes to respond when a prospect replies.
Track median response time and the percentage of inquiries answered within your target window.
LeadTaro users can organize prospects and manage their follow-up workflow, helping sales teams maintain a more consistent process.
KPI #16: Follow-Up Frequency
What it measures: The number of outreach attempts made to each prospect over a defined period.
Many prospects will not respond to a single message. A structured follow-up process helps you test whether additional contact improves engagement.
Track:
Average outreach attempts per prospect
Reply rate after each attempt
Meetings generated by follow-up sequence
Opt-out and complaint rates
Opportunities and revenue generated
A follow-up sequence should reflect the prospect, channel, and nature of the offer. There is no single number of attempts that works for every campaign.
Use LeadTaro's lead organization and cold-email workflow to prepare personalized outreach, then evaluate results using your campaign data.
KPI #17: Call Connection Rate
What it measures: The percentage of outbound calls that reach the intended person or result in a meaningful conversation.
Use this formula:
Call Connection Rate = Successful Connections ÷ Total Calls Attempted × 100
If 200 calls produce 30 successful connections, your connection rate is 15%.
Track the metric by phone type, industry, territory, and time of day when practical.
A connected call is not necessarily a qualified conversation, so also measure the percentage of connections that become meetings or opportunities.
Accurate, relevant contact information can help improve calling efficiency, but phone-number availability should never be confused with guaranteed reachability.
KPI #18: Sales Cycle Length
What it measures: The time between the beginning of a defined sales process and a closed deal.
Use a consistent start point, such as the first meaningful contact or the date a prospect becomes a qualified opportunity.
For example, if an opportunity is qualified on 1 September and closes on 1 October, its sales cycle is 30 days.
Calculate the median sales cycle as well as the average. A few unusually long deals can distort the average.
Segment the results by industry, customer size, deal value, and acquisition channel to find which types of prospects move through your pipeline most efficiently.
KPI #19: Pipeline Velocity
What it measures: How quickly your sales pipeline generates potential revenue.
A commonly used formula is:
Pipeline Velocity = (Qualified Opportunities × Average Deal Value × Win Rate) ÷ Average Sales Cycle Length
Suppose your team has 40 qualified opportunities, an average deal value of £2,000, a 25% win rate, and an average sales cycle of 40 days.
Your estimated pipeline velocity is:
(40 × £2,000 × 0.25) ÷ 40 = £500 per day.
This is a simplified planning metric, not a guarantee of daily revenue. Use consistent units and comparable pipeline snapshots when monitoring trends.
You can improve pipeline velocity by qualifying prospects more effectively, reducing unnecessary delays, and focusing on opportunities with a stronger likelihood of closing.
KPI #20: Win Rate by Territory
What it measures: The percentage of sales opportunities that become customers in each geographic market.
Use this formula:
Territory Win Rate = Closed-Won Opportunities ÷ Total Decided Opportunities × 100
Suppose your team has 50 decided opportunities in one region and wins 15. Its win rate is 30%.
Compare territories using similar customer profiles, qualification criteria, and observation periods.
A region with a lower lead volume may still be attractive if prospects there have larger deal sizes or higher win rates.
LeadTaro's location-based business discovery can help you build prospect lists for different markets. Record territory consistently in your sales pipeline so you can compare results over time.
Industry Benchmarks for Local Prospecting
Prospecting performance varies considerably by industry, offer, deal size, market maturity, and outreach channel.
A campaign targeting businesses with an obvious need may perform differently from one promoting a service that prospects have not actively considered.
Rather than treating one published benchmark as a universal target, establish a baseline from your own campaigns and improve it over time.
Conversion Rates by Industry
When evaluating conversion rates, first define what counts as a conversion. A reply, booked meeting, qualified opportunity, proposal, and closed sale are different outcomes.
Use a table like this to build your own benchmarks:
IndustryMetrics to MonitorFactors to ConsiderFood and beverageReply rate, meeting rateBusy operating hours, local competitionProfessional servicesQualified lead rate, win rateReputation, expertise, trustHealthcareContact rate, qualified opportunitiesDecision-making processes, complianceHome servicesCost per qualified lead, win rateSeasonality, service areaRetailReply rate, average deal sizeStore size, margins, purchasing needsLuxury businessesSales cycle, average deal sizeTrust, budgets, longer considerationThese are suggested measurement priorities, not claimed industry-average conversion rates. Build reliable targets from comparable campaigns and verified sales data.
Cold Email Performance for Local Business Leads
Cold email can be useful for reaching relevant businesses, particularly when the message addresses a specific need. However, performance depends on list quality, deliverability, relevance, sending practices, and the recipient's interest.
Track the following metrics separately:
MetricWhat It Tells YouDelivery rateHow many messages were successfully deliveredBounce rateHow many messages could not be deliveredReply rateHow many recipients repliedPositive reply rateHow many replies expressed meaningful interestMeeting booking rateHow often outreach resulted in a meetingOpportunity conversion rateHow many contacts became qualified opportunitiesUnsubscribe rateHow often recipients asked to stop receiving messagesDo not assume that business leads discovered through public listings will automatically outperform other prospect sources. Compare actual campaign results using consistent definitions.
Personalization can help make outreach more relevant. For example, a web agency might explain how a business could improve its website, while a reputation management provider might reference a specific customer-experience challenge.
LeadTaro supports business lead discovery, available contact research, and personalized cold-email preparation, helping you connect prospect research with the next steps in your sales process.
How to Track Prospecting KPIs with LeadTaro
Tracking 20 metrics does not require a complicated analytics system from day one. Start with a repeatable process and expand as your sales operation grows.
Step 1: Discover Relevant Business Leads
Define your ideal customer profile before starting a campaign.
Specify the industries, locations, business types, and characteristics that matter to your offer.
Use LeadTaro to discover relevant businesses and review the information available for each prospect. Depending on the business record, this may include its name, category, address, website, phone number, and available contact details.
Avoid collecting records simply because they are available. Every campaign should have a clear reason for targeting its chosen audience.
Step 2: Qualify and Organize Prospects
Review the collected information and determine which businesses meet your criteria.
You can prioritize prospects according to factors such as:
Industry and location fit
Website presence and quality
Relevant business needs
Contact information availability
Potential deal size
Likelihood of becoming a customer
Remove duplicates and flag records that need further verification.
LeadTaro's lead management workflow helps you keep prospects organized rather than leaving research scattered across browser tabs and spreadsheets.
Step 3: Export and Prepare Your Lead List
Once your prospects are ready, export available lead data to CSV where your plan and account permissions support it.
Use the data to prepare targeted campaigns, enrich your CRM records, or assign prospects to sales representatives.
Maintain consistent source, campaign, territory, and qualification fields so that you can attribute results later.
Before launching an outreach campaign, check that your contact data is appropriate for the intended use and that your campaign complies with applicable privacy and marketing rules.
Step 4: Personalize Outreach
Use your prospect research to prepare messages that address the recipient's likely needs.
For example, a web development agency might explain how an outdated website could affect customer inquiries. A marketing provider might offer suggestions based on a business's public-facing online presence.
LeadTaro's AI-assisted cold-email workflow can help you prepare personalized drafts. Review every message before sending to ensure that claims are accurate and that the content is genuinely relevant.
Measure reply rates, positive responses, meetings, and qualified opportunities rather than relying only on the number of messages sent.
Step 5: Track Leads Through Your Sales Pipeline
A lead list becomes more useful when every prospect has a clear status and next action.
LeadTaro provides a sales pipeline for organizing prospects through stages such as New Lead, Contacted, Interested, Meeting, and Closed.
Use these stages consistently. Define when a prospect moves from one stage to another, and record follow-up activities where appropriate.
This allows you to identify bottlenecks, understand which stages lose the most prospects, and calculate meaningful conversion rates.
Step 6: Review Performance and Improve
Establish a regular review schedule.
Daily: New leads, outreach activity, responses, and follow-up tasks.
Weekly: Qualified opportunities, conversion rates, channel performance, and pipeline movement.
Monthly: Customer acquisition cost, average deal size, customer lifetime value, win rate, and sales cycle length.
Use the findings to adjust your targeting, messaging, qualification rules, and follow-up process.
The objective is continuous improvement, not collecting metrics for their own sake.
Common Mistakes When Measuring Local Prospecting
Mistake #1: Counting Activities Instead of Results
Sending 500 emails or making 100 calls tells you how much activity occurred. It does not tell you whether the campaign produced revenue.
Track activities alongside replies, qualified opportunities, meetings, and closed deals.
Mistake #2: Applying the Same Benchmarks to Every Industry
Different industries have different buying processes, budgets, and sales cycles.
Compare similar campaigns and segment your results by customer type, territory, and offer.
Mistake #3: Ignoring Data Quality
A large prospect list can still perform poorly if business details are incorrect, records are duplicated, or contact information is outdated.
Monitor completeness, freshness, bounce rates, and connection rates to understand how data quality affects results.
Mistake #4: Measuring Only Lead Volume
More leads do not necessarily mean more sales.
A campaign that produces 100 highly qualified prospects may outperform one that generates 2,000 poorly matched businesses.
Measure cost per qualified lead and opportunity conversion alongside volume.
Mistake #5: Failing to Track Follow-Ups
Prospects can disappear from your pipeline when no one owns the next action.
Assign responsibility, record outreach attempts, and define follow-up procedures. Use your CRM or LeadTaro's sales pipeline to maintain visibility into prospect status.
Mistake #6: Ignoring Attribution
If you do not record where a lead came from, it becomes difficult to know which channels generate profitable customers.
Maintain consistent source and campaign fields, then connect prospecting activity with opportunities and closed revenue.
Mistake #7: Overlooking Privacy and Outreach Compliance
Publicly accessible business information does not automatically make every use of that information lawful.
Depending on your location, audience, and communication channel, you may need to consider data protection, electronic marketing, legitimate-interest assessments, consent requirements, and opt-out obligations.
For UK campaigns, review the applicable UK GDPR and PECR requirements. For US campaigns, consider the CAN-SPAM Act and any other applicable rules.
Use accurate sender identification, respect objections and opt-outs, and ensure that your outreach practices comply with the rules relevant to your campaign.
A Practical Prospecting KPI Dashboard
You do not need to display all 20 KPIs on your main dashboard. Start with a small group that explains whether your prospecting operation is healthy.
Dashboard MetricWhat to TrackTarget SettingLeads GeneratedNew unique prospects per weekBased on team capacityQualified Lead RateQualified leads ÷ total leadsEstablish a baselineCost Per Qualified LeadProspecting costs ÷ qualified leadsBased on deal economicsPositive Reply RatePositive replies ÷ delivered messagesBased on campaign historyOpportunity Conversion RateQualified opportunities ÷ leads contactedBased on your sales processPipeline ValueValue of active qualified opportunitiesBased on revenue goalsWin RateClosed-won ÷ decided opportunitiesBased on historical resultsAverage Sales CycleTime from qualification to closeTrack median and trendReview the main dashboard weekly, then investigate the underlying metrics whenever performance changes.
For example, if lead volume rises but opportunities remain flat, investigate qualification and outreach quality. If opportunities increase but revenue does not, review the proposal and closing stages.
LeadTaro can help with the business discovery, contact research, lead organization, and sales pipeline stages of this process. A consistent measurement system turns those activities into actionable insights.
Frequently Asked Questions
What is the most important KPI for local business prospecting?
Lead-to-opportunity conversion rate is a useful starting point because it shows how effectively your prospecting efforts generate qualified sales opportunities.
However, it should not be measured alone. Combine it with cost per qualified lead, win rate, and average deal size to understand whether the opportunities are commercially valuable.
How often should I track local prospecting KPIs?
Review operational activity daily, conversion and pipeline metrics weekly, and acquisition economics monthly.
Use the same metric definitions and reporting periods so you can compare results accurately.
What is a good cost per lead for local prospecting?
There is no universal cost-per-lead target. An acceptable CPL depends on your industry, lead quality, average deal size, conversion rate, and customer acquisition economics.
A lead costing £5 may be expensive if it never converts, while a lead costing £50 may be profitable if it regularly generates valuable customers.
For that reason, measure cost per qualified lead and cost per acquired customer as well as raw CPL.
How can business lead data improve KPI tracking?
Structured business data allows you to segment prospects by industry, location, website presence, and available contact details.
This makes it easier to compare campaigns, evaluate lead quality, identify missing information, and understand which prospect characteristics correlate with successful outcomes.
The quality of those insights depends on the accuracy and completeness of the underlying data.
Which KPIs should a startup prioritize?
Start with five metrics:
Qualified leads generated: Are you finding enough relevant prospects?
Positive reply rate: Is your outreach generating interest?
Lead-to-opportunity conversion rate: Are prospects progressing into your pipeline?
Customer acquisition cost: Can you acquire customers efficiently?
Average deal size and customer lifetime value: Is each customer worth the acquisition effort?
Add more metrics as your campaigns and sales pipeline mature.
How does LeadTaro help with local prospecting?
LeadTaro is a business lead generation and sales workflow platform designed to help users discover businesses, review available lead information, organize prospects, export supported data, and prepare personalized cold emails.
Its sales pipeline helps users track prospects as they move through different stages of the sales process.
By combining these workflows with consistent KPI tracking, sales teams can evaluate their prospecting performance and focus on the activities most likely to generate qualified opportunities.
Conclusion
Successful local business prospecting is about more than building a large contact list. It requires a clear understanding of lead quality, outreach effectiveness, acquisition costs, and sales performance.
Start with a small set of meaningful KPIs, define each metric consistently, and review your results regularly. Use those findings to refine your target market, improve your outreach, and prioritize the prospects most likely to become customers.
LeadTaro helps bring business lead discovery, prospect organization, personalized outreach preparation, and sales pipeline management into one workflow. Combined with a practical KPI framework, it gives sales teams a clearer way to move from finding businesses to building real sales opportunities.