How to Use LeadBoba Dashboard: Complete Lead Management Overview 2026
A powerful lead generation platform should not only help you find prospects. This guide covers how the LeadBoba Dashboard gives you a complete overview of your lead activity, pipeline, and data quality in one place.
LeadBoba Dashboard's overview of leads, pipeline, and data quality
A powerful lead generation platform should not only help you find prospects.
You also need a simple way to understand your lead activity, track opportunities, analyze data quality, and manage your entire sales workflow. The LeadBoba Dashboard gives users a complete overview of their lead generation activity in one place.
From total leads discovered to saved prospects, CRM pipeline activity, lead quality scores, contact information coverage, and recent opportunities, the dashboard helps businesses understand their sales pipeline at a glance.
What Is the LeadBoba Dashboard?
The LeadBoba Dashboard is the central overview page where users can monitor their lead generation performance. Instead of checking multiple tools or spreadsheets, users can quickly see:
- How many leads they have discovered
- How many leads are saved
- How many prospects are currently in the CRM pipeline
- Average lead quality score
- Available contact information
- Industry breakdown
- Lead activity trends
- Recent discovered businesses
The dashboard helps businesses make better decisions by showing important lead insights in one place. When users open the LeadBoba Dashboard, they can immediately see a summary of their current lead activity — a quick snapshot of prospecting performance right from the welcome screen.
Track Your Core Lead Metrics
The Total Leads section shows the total number of business leads discovered through LeadBoba, helping users understand their overall prospect database size. The Saved Leads section shows prospects users have selected for future review, letting them organize opportunities and prepare outreach before sending leads to CRM. The In Pipeline section shows how many prospects are currently being managed inside CRM, helping users understand how many active sales opportunities they have.
As users continue discovering businesses, these numbers grow and provide a clear view of their lead generation activity.
Lead Score and Lead Quality Analysis
LeadBoba automatically calculates a lead score based on available business information. The score considers important factors such as:
- Email availability
- Phone number availability
- Website presence
- Social media profiles
- Business information completeness
- Google rating data
A higher lead score usually indicates that more useful contact information is available, helping users prioritize higher-quality prospects.
Contact Information Coverage
The Dashboard shows how much contact information is available across discovered leads, helping users understand the quality and usability of their lead database.
Pipeline Stage Overview
The Dashboard provides a visual summary of CRM pipeline activity. Users can see how many leads are currently in each stage:
Users can identify where prospects are located in the sales process, allowing businesses to quickly understand their sales progress.
Top Industries
The Dashboard shows which industries appear most frequently in your lead database, helping users understand their prospecting focus and discover market trends.
| Industry | Leads |
|---|---|
| Coffee & Café | 4 |
| Beauty & Salon | 3 |
| Dental | 2 |
| Cleaning Services | 2 |
| Marketing & Advertising | 1 |
| Fitness & Gym | 1 |
Lead Score Distribution
LeadBoba provides a visual breakdown of lead quality. The dashboard displays lead distribution across different score ranges:
- 0–2
- 3–4
- 5–6
- 7–8
- 9–10
This helps users quickly identify high-quality prospects, average opportunities, and leads requiring additional research.
Lead Discovery Activity Tracking
The Dashboard tracks lead discovery activity over time. Users can view how many leads were discovered during each day of the week:
- Monday
- Tuesday
- Wednesday
- Thursday
- Friday
- Saturday
- Sunday
This helps businesses understand their prospecting consistency and activity patterns.
Recent Leads
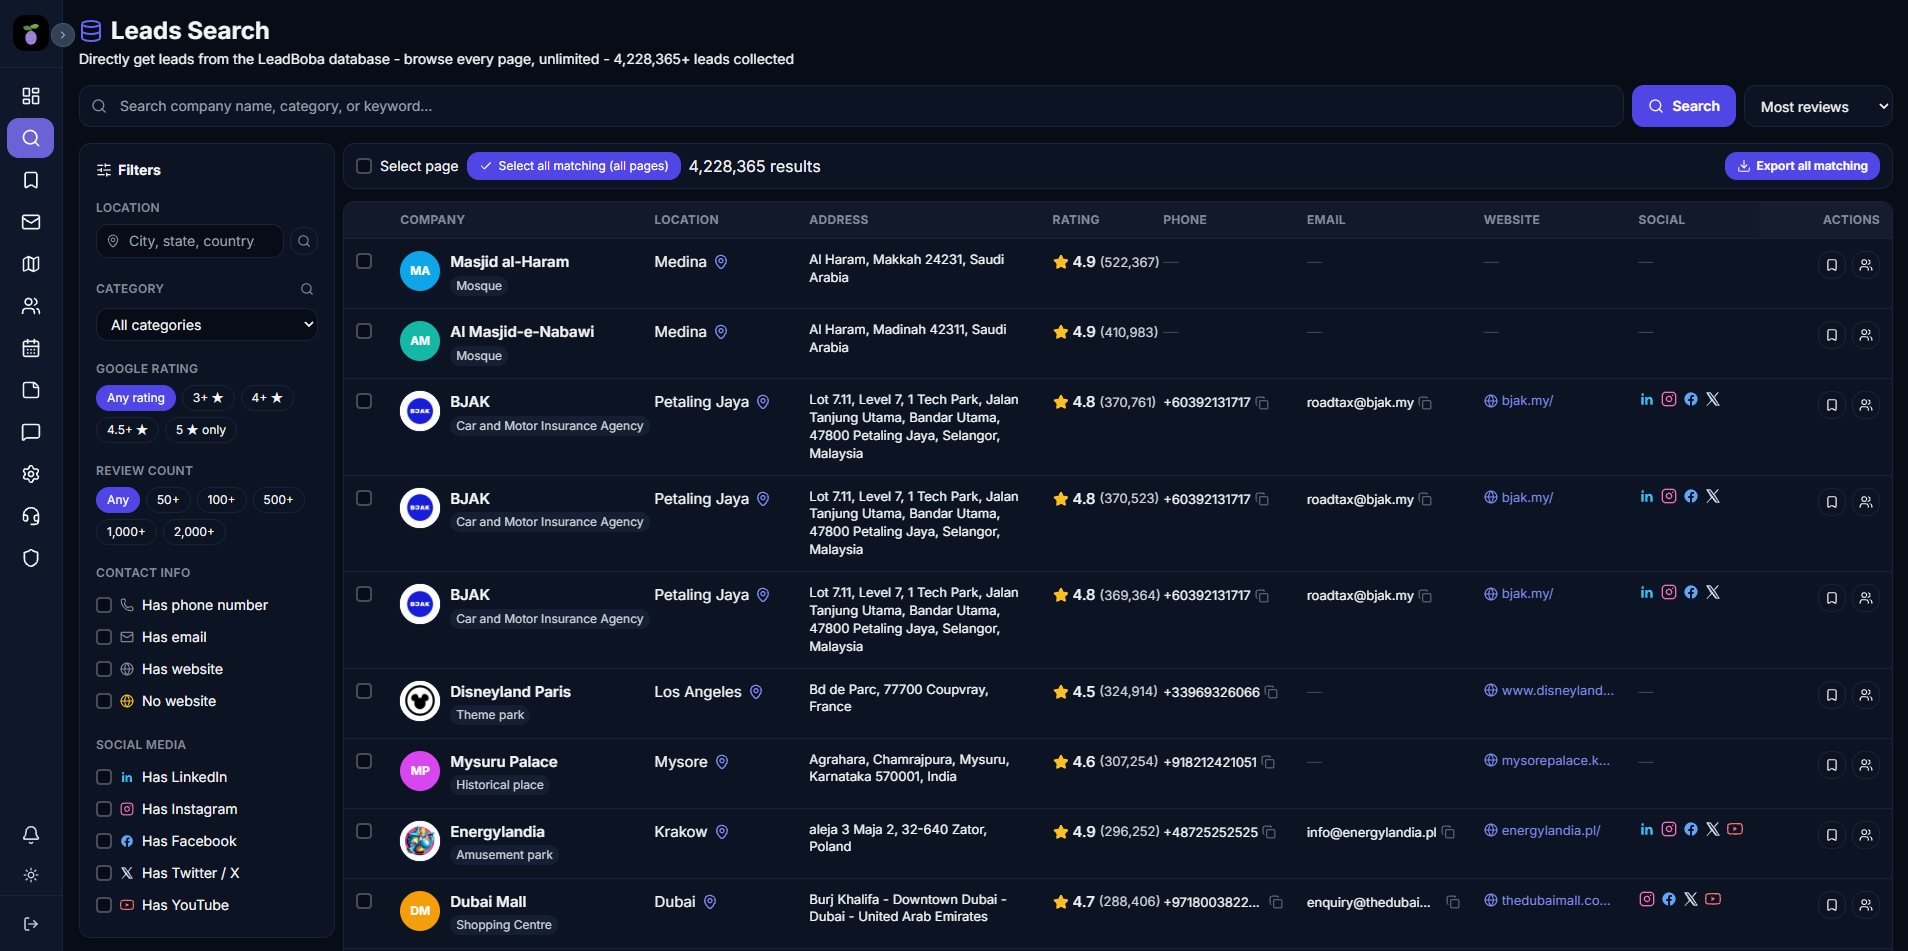
The Recent Leads section displays the latest discovered businesses. Users can quickly view important prospect information including company name, address, lead score, pipeline status, and saved status.
47 Brick Ln, London E1 6RL, United Kingdom
294 Richmond St E #101, Toronto, ON M5A 1P5, Canada
Users can open any lead to view complete business details.
Quick Actions
The Dashboard provides shortcuts to common LeadBoba features. Users can quickly access:
- Search Businesses — discover new companies by industry and location
- View Saved Leads — review saved prospects
- Open CRM Board — manage leads through the sales pipeline
- View Calendar — manage scheduled activities
- Open Memo — store important notes
- Open Map — explore business locations
- Send Cold Email — create outreach campaigns
- View Community — connect with other users
These shortcuts help users move quickly between important workflows.
Manage Complete Lead Information
Every lead discovered through LeadBoba contains detailed business information. Users can view:
- Company name
- Category
- Address
- Phone number
- Email information
- Website
- Twitter/X
- YouTube
- Google rating
- Review count
- Google Maps URL
The Dashboard provides quick access to these opportunities.
Why Use LeadBoba Dashboard?
Without a centralized dashboard, businesses often struggle to understand their sales activity. Common problems include:
- Leads scattered across spreadsheets
- No visibility into pipeline progress
- Difficult quality assessment
- Missing follow-up opportunities
LeadBoba Dashboard solves this by providing:
- Lead analytics
- CRM overview
- Contact coverage insights
- Lead scoring
- Industry analysis
- Recent activity tracking
Start Managing Your Lead Generation Activity with LeadBoba
Finding leads is only the first step. Successful businesses need visibility into their prospecting activity, lead quality, and sales pipeline.
The LeadBoba Dashboard gives users a complete overview of discovered businesses, saved prospects, CRM opportunities, and lead performance.
Whether you are a marketing agency, sales team, freelancer, or business owner, LeadBoba helps you understand and manage your entire lead generation workflow.
Start tracking your leads smarter today
See total leads, saved prospects, CRM pipeline activity, and lead quality scores all in one dashboard.
Leads Generator
Target businesses you won't find on LinkedInExtract leads from Google Maps, Apple Maps and Bing Maps
Restaurant in your area